Aug 2025
Tesla Battery Sponsorship
Tesla
Team selected for its high-voltage FSAE battery proposal.
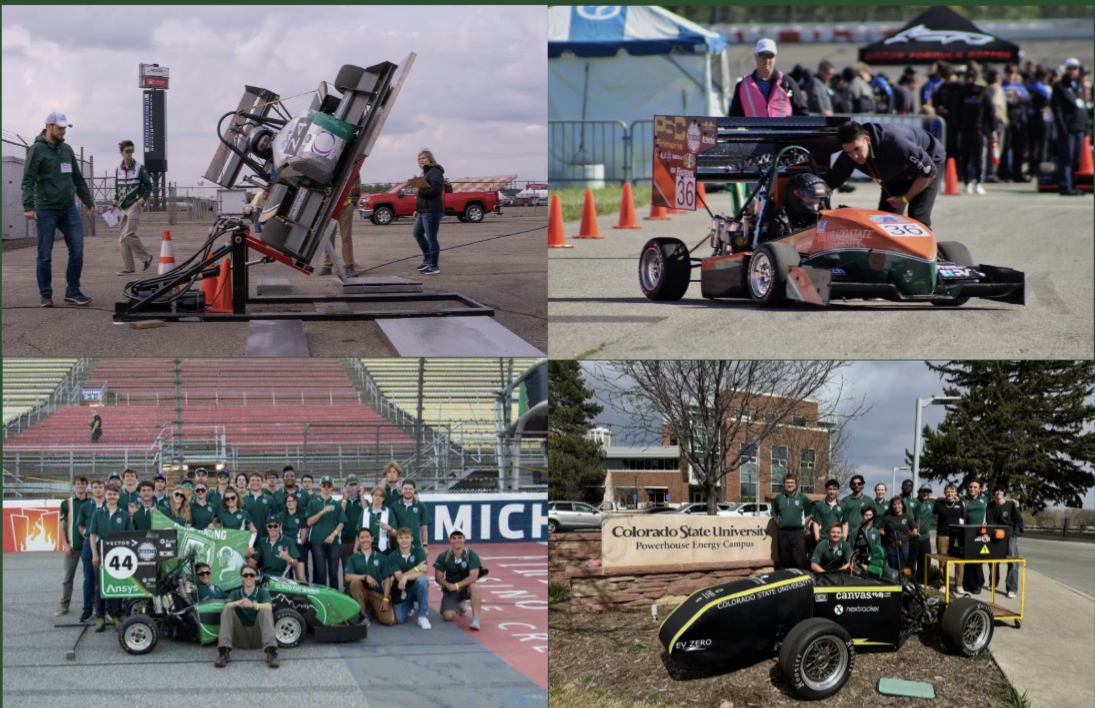
I founded Colorado's first Formula SAE Electric Vehicle program and designed a 324V, 8.64kWh battery system that earned a Tesla sponsorship. Across four competition vehicles, I've designed custom PCBs (BMS, safety interlocks, telemetry), written CAN test frameworks for fault validation, and architected full vehicle harnesses integrating 30+ sensors.
I scaled RAM Racing from 30 to 60+ members, raised $400K, and shipped four competition vehicles, building a team culture around precision, ownership, and real engineering accountability.
 01Interlatent
Robot teleoperation, hardware integration & agent validation
RoboticsVR / IKQUICAgent Evaluation
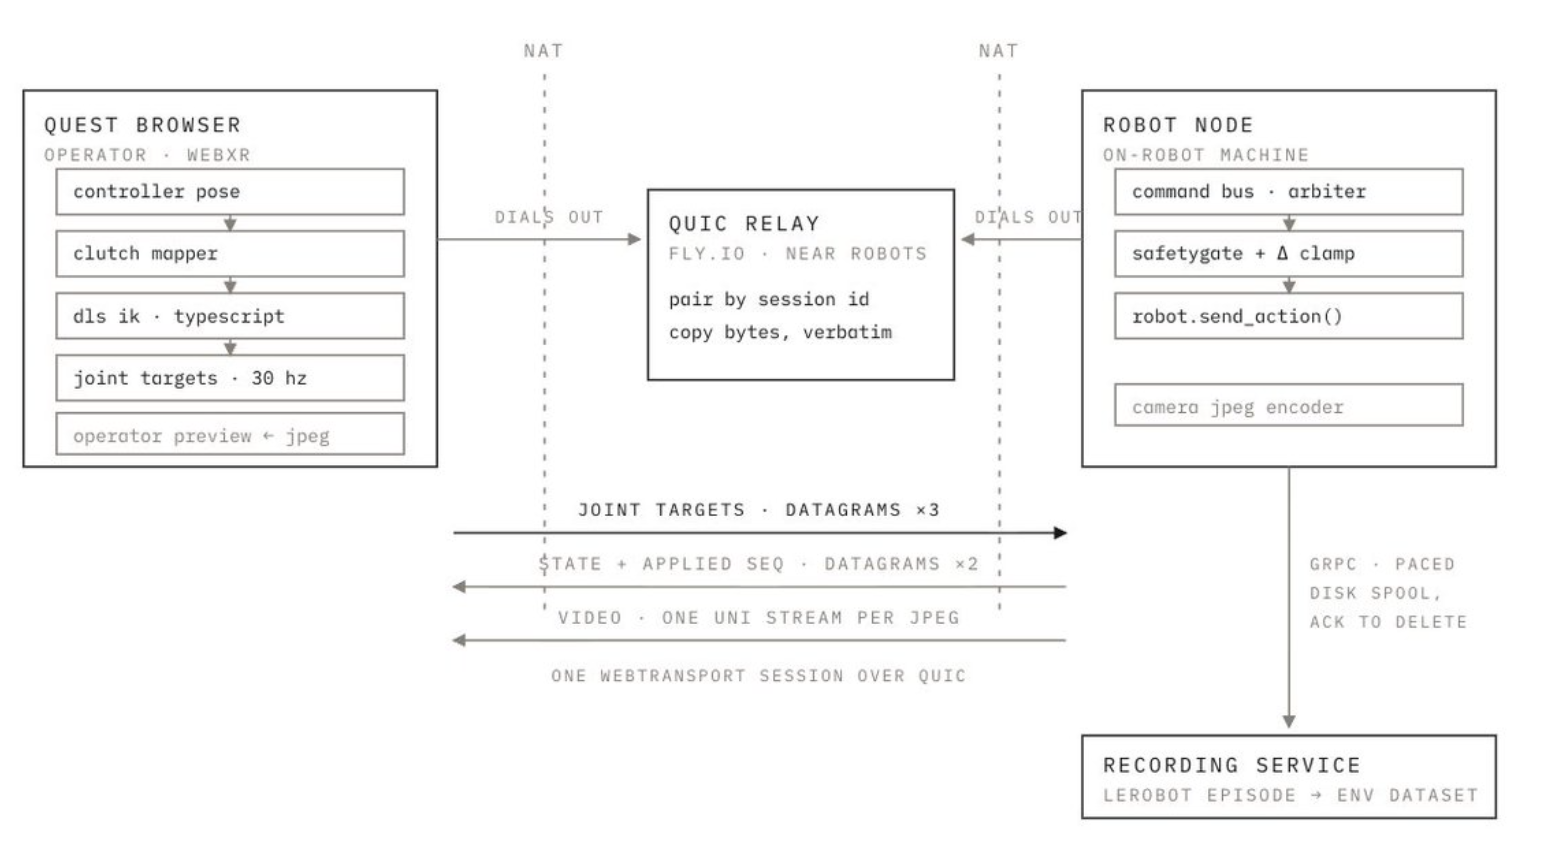
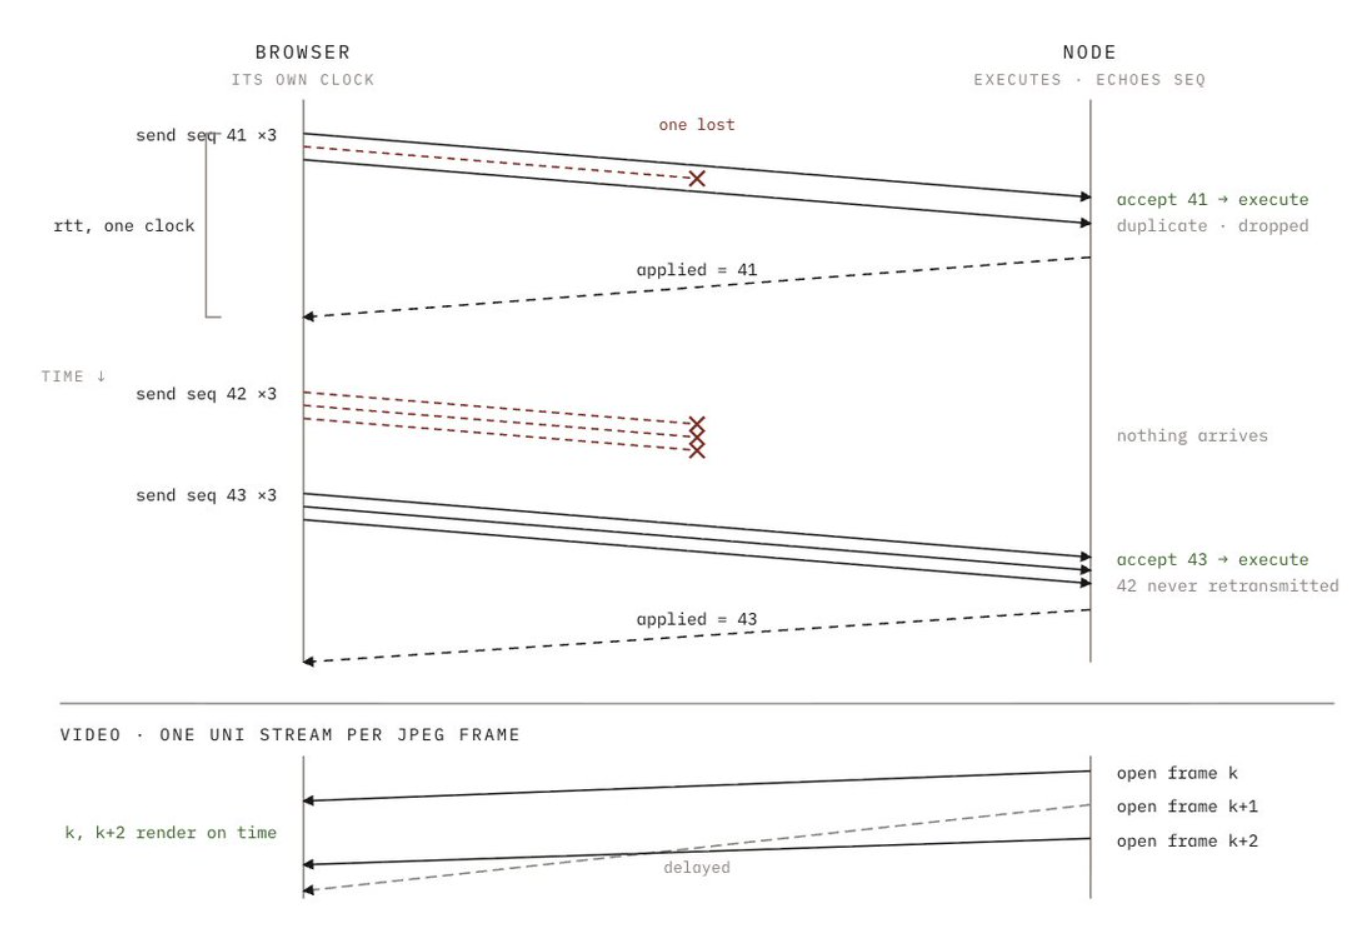
Interlatent turns robot demonstrations into training-ready datasets. I worked on teleoperation and agent validation across NORI, Dimensional OS, I2RT YAM, SO-101, and Axol.
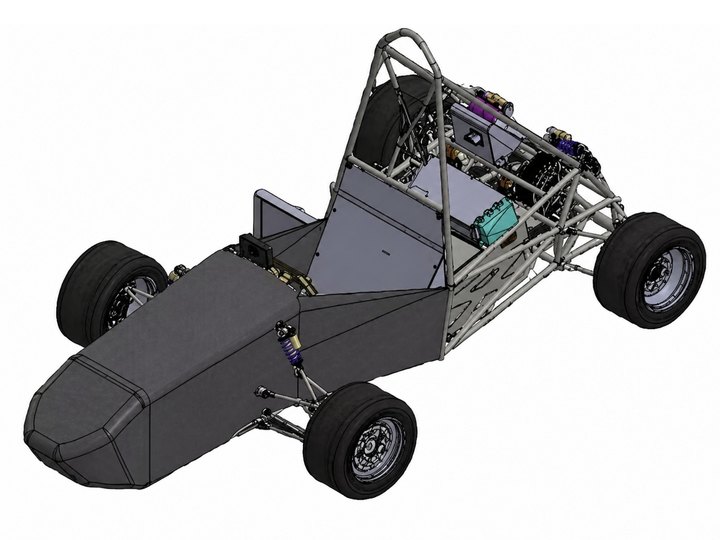 02Venus EV
Colorado's flagship FSAE Electric car, full HV accumulator & safety stack
HV Accumulator324V BatteryBMSKiCadSystem Integration
As Electrical System Officer for the 2026 car, I managed the LV and HV subteams while personally focusing on energy experimentation to deliver the program's first competition-bound battery pack, balancing the technical demands against the challenge of building it as cheaply as possible so the other subteams had the budget to build the rest of the car.
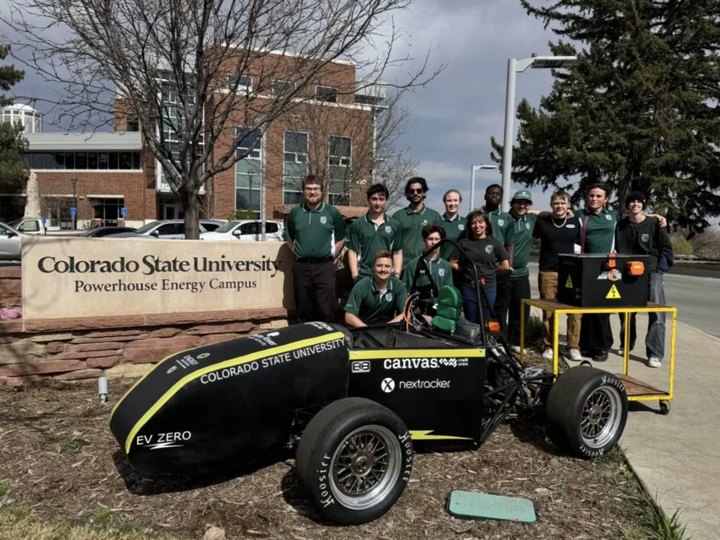 03Rubicon EV
First CSU EV car, full vehicle electrical architecture & safety systems
System ArchitectureTractive SystemBrake PlausibilityPowertrainVehicle Integration
As Chief Engineer of CSU's first electric car, I owned the full vehicle architecture and supported the powertrain and suspension teams, managing timelines across six mechanical and electrical subteams to deliver the first FSAE EV prototype in the Rocky Mountain region.
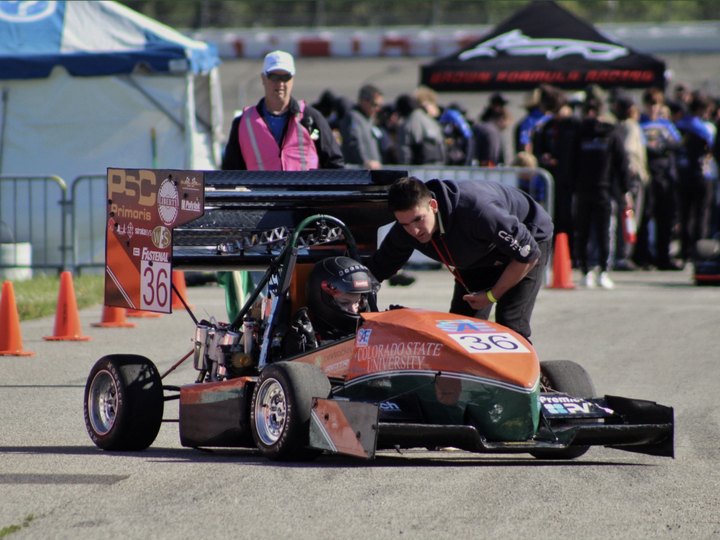 04Intrepid IC
Combustion car, full harness integration & wireless telemetry
Wiring HarnessCAN BusHaltech ECUTelemetry30+ Sensors
On the combustion car, our two-person electrical team delivered the full vehicle harness and a wireless telemetry unit, the foundation that later grew into sensor fusion and autonomous work.
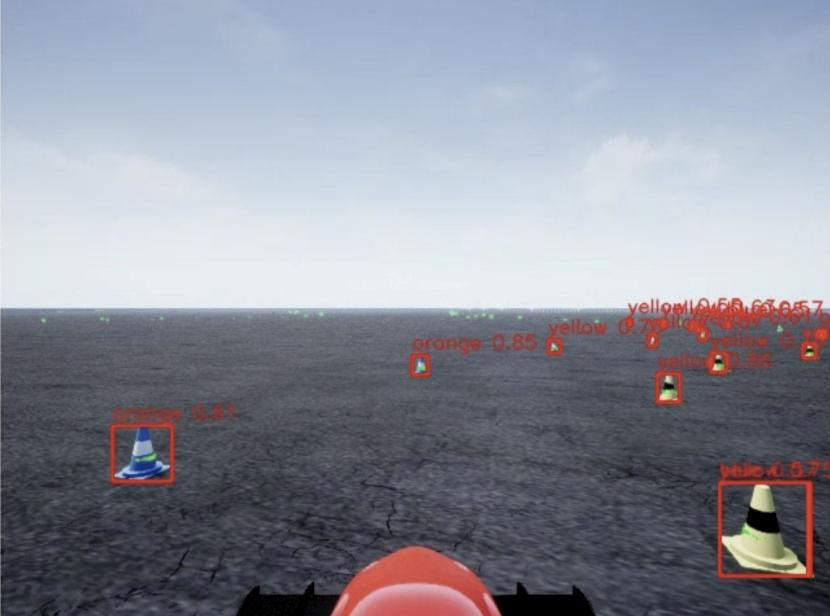 05Driverless
Perception, anomaly detection & steering control in the Formula Student Driverless Simulator
LiDAR + CameraYOLOXGBoostSAC / PPO
I built and evaluated a simulated driverless racing stack, from cone sensing and color validation to steering policy research. The three walkthroughs below cover each part of that work.
Fused LiDAR and camera detections for reactive cone following, reaching 6 cm average match accuracy and resolving straight-line weaving from the LiDAR-only controller.
Read the sensor fusion walkthroughLabeled 129,025 cone detections and trained an XGBoost safety gate that reduced incorrect color labels reaching control by about 91%.
Read the anomaly detection walkthroughAnalyzed six Soft Actor-Critic training runs, diagnosed structural failure modes, and developed a PPO training environment for comparison.
Read the steering control walkthrough 06Other Projects
Selected work, embedded systems, automotive cybersecurity & early CSU race cars
A few standout projects beyond my lead Formula SAE roles, from a competition-winning embedded clock and heavy-vehicle cybersecurity to the early CSU race cars where I cut my teeth on harnesses and vehicle instrumentation.
Team selected for its high-voltage FSAE battery proposal.
Profiled for engineering work with CSU Ram Racing.
Won with a custom PCB and embedded system.
Merit award for academic performance and ECE contributions.
Recognized for a 4.0 GPA.
Merit scholarship for international students.
Tuition waiver for the highest GPA in the cohort.
Recognized as a top regional high school graduate.
First student in school history to earn a perfect GPA.




Get in touch for collaboration.
We present a two-phase system for detecting and suppressing YOLO color misclassifications in Formula Student Autonomous (FSA) vehicles before they reach the path planner. In Phase 1, a ROS2 ground-truth bridge and four-stage spatial matching pipeline labeled 129,025 cone detections collected across multiple track laps in the Formula Student Driverless Simulator (FSDS), revealing a baseline false-positive rate of 2.52% with pronounced Orange-class fragility at 24.4%, 9.7× the population mean. Analysis identifies three compounding error drivers: low YOLO confidence, long detection range (beyond 8 m), and corner-induced camera rotation. In Phase 2, this labeled dataset trains a two-model XGBoost Safety Gate framed as supervised anomaly detection. Seventeen features are used, including five engineered context features. On the held-out test set the combined system achieves F1 = 0.906, PR-AUC = 0.976, and ROC-AUC = 0.999. The detector reduces the rate of incorrect color labels reaching the steering controller from 2.73% to approximately 0.24%, a 91% reduction in the failure mode that causes incorrect lane assignment.
Formula Student Autonomous (FSA) vehicles navigate tracks defined exclusively by colored cones: blue on the left boundary, yellow on the right, and orange as markers for the start/finish line and chicane entries. YOLO-based color classification is the perception layer used in the simulator pipeline, but it fails silently, returning a plausible color label with high apparent confidence even when incorrect. There is no built-in mechanism to distinguish a correct high-confidence prediction from a confident misclassification.
The consequences are asymmetric. A blue/yellow confusion causes the path planner to assign the wrong lane boundary, which can induce a terminal trajectory error. An orange/yellow confusion at the start/finish can cause the lap counter to fail or the chicane maneuver to trigger incorrectly. Because anomalies occur at a low baseline rate of 2.52%, per-frame accuracy metrics treat them as statistical noise until they cause a planning failure.
This paper addresses the problem in two phases: (1) constructing a ground-truth dataset that labels each detection as correct or anomalous, and (2) training a Safety Gate that intercepts anomalies before they reach the steering controller, with no modification to YOLO itself.

All data was collected in the Formula Student Driverless Simulator (FSDS), an Unreal Engine-based simulator with physics-accurate vehicle dynamics and sensor emulation.


orange: 0.81. Distant yellow cones carry incorrect orange and blue labels at confidence above 0.70. These silent misclassifications reach the path planner unchanged. A per-frame accuracy metric counts them as correct 97.5% of the time.ROS2 ground-truth bridge. FSDS publishes the complete simulator-authoritative track layout on the ROS2 topic /fsds/testing_only/track at the simulator frame rate. A dedicated ROS2 node subscribes and caches the latest cone array at each callback. When a YOLO detection frame arrives, the node synchronizes both streams and passes the track state to the matching pipeline. This eliminates all API-level defects: coordinates are in the native world frame, data is frame-synchronous, and no scaling correction is required.
Ground-truth assignment proceeds in four deterministic stages:
A color mismatch between the YOLO prediction and the simulator-assigned cone class is labeled a false positive (anomaly). YOLO labels were further corrected using HSV-space post-processing to suppress known hue ambiguities in the simulator renderer.
Range filter (1 m to 18 m). Detections below 1 m are excluded due to partial occlusion by the vehicle nose. Above 18 m, projection error grows quadratically and the observed 8.5% anomaly rate at 20 to 30 m is dominated by label noise rather than genuine YOLO failure. The filter retains the actionable anomaly signal.
| Color | Detections | FP count | FP rate |
|---|---|---|---|
| Yellow | 64,495 | 1,988 | 3.1% |
| Blue | 65,288 | 963 | 1.5% |
| Orange | 1,242 | 303 | 24.4% |
| Total | 129,025 | 3,254 | 2.52% |
Orange cones represent less than 1% of total detections but contribute 9.7× the mean FP rate.
The rolling FP rate over a 500-detection sliding window stabilizes at a mean of 2.52%, but the signal oscillates continuously between 0% and 6.5% with no sustained convergence. The oscillation is consistent with velocity- or curvature-induced transients: FP rate spikes when the vehicle corners aggressively, then recovers as the heading stabilizes. No monotonic drift is visible across the 4,500-second timeline, confirming that the ground-truth labeling does not degrade over time.

Binning FP count by match distance in 0.05 m intervals reveals a monotonically increasing distribution: virtually no FPs below 0.2 m; counts rise steeply beyond 0.8 m. The cumulative distribution shows 80% of all FPs fall within 1.36 m of the 1.5 m matching threshold. This is consistent with projection error at range: cones beyond 8 m subtend fewer pixels in the image plane, reducing the YOLO head color discrimination. Tightening the spatial threshold to 1.2 m eliminates the high-error tail while retaining over 95% of true positive matches.
Kernel density estimation of YOLO confidence scores across correct detections and FPs reveals strong separability. Correct detections peak sharply at 0.774. FPs exhibit a bimodal structure: a primary cluster below 0.45 (mean 0.492) and a secondary tail extending to 0.75. The sub-0.45 cluster represents the directly recoverable FP population, addressable by a confidence threshold alone. FPs above 0.70 represent hard negatives that require spatial discrimination to detect: their confidence is indistinguishable from correct detections by a single-threshold rule.
Per-class FP rates diverge substantially from the 2.52% baseline. Blue achieves the lowest rate at 1.5%, attributable to spectral unambiguity in the simulator rendering pipeline. Yellow produces 3.1%, consistent with mild hue-saturation variation under motion blur. Orange presents a qualitatively distinct failure mode at 24.4% (303 FPs from 1,242 detections), exceeding the baseline by 9.7×.
Row-normalized confusion analysis exposes the mechanism: of all ground-truth Orange detections, 11.5% are predicted Yellow and 3.1% Blue. Orange occupies a narrow hue band between yellow and red; under motion blur or at range, the YOLO head collapses this distinction. Yellow shows only 1.5% leakage to Blue, the complementary direction, confirming hue-proximity causation rather than a systematic rendering artifact. In FSA competition, an Orange-to-Yellow confusion can cause the planner to treat a mandatory maneuver boundary as a normal track edge.

Plotting all 3,254 FPs in the joint space of YOLO confidence and match distance reveals a concentrated high-density cluster at distance > 1.2 m AND confidence < 0.70. Orange FPs are disproportionately concentrated in this zone, confirming the Orange failure is range-amplified. A simple threshold rule catches the majority of the high-density cluster but misses hard negatives: FPs with high confidence that lie outside the zone but still represent real misclassifications. The joint feature space requires a non-linear decision surface, which is exactly what gradient boosting learns.
Four properties of this problem make XGBoost the natural choice over deep learning, logistic regression, or kernel methods:
scale_pos_weight = Nneg/Npos ≈ 36, amplifying the gradient contribution of anomaly examples without resampling. No SMOTE or undersampling is required.The regularized training objective is:
where l is binary logistic loss and Ω penalizes tree complexity (T = leaf count, w = leaf weights). Trees are added sequentially, each fitted to the negative gradient of the current ensemble loss.
Hyperparameters (boundary / orange models): n_estimators = 500 (early stopping, patience = 30), max_depth = 5 to 6, learning_rate = 0.05, subsample = 0.8, colsample_bytree = 0.8, reg_alpha = 0.1. All tuned on the validation split.
The Phase 2 training set is the labeled output of the Phase 1 pipeline: 200,000 detections from 18,218 frames, 5,455 anomalies (2.73% rate). The frame-level split into 139,128 train / 30,263 val / 30,547 test (70/15/15) is performed by sorting on frame_id (simulator time) and splitting at the corresponding percentile boundaries. This prevents label leakage between cones co-detected in the same frame.
Raw features (12): yolo_confidence, bbox_h, aspect_ratio, x_car, y_car, bearing_deg, yaw_rate_radps, car_speed_mps, prior_disagreement, yc_blue, yc_yellow, yc_orange.
Engineered features (5). These encode spatial context and temporal priors that a single-frame YOLO output cannot represent:
neighbor_agree, fraction of K = 3 nearest cones in the same frame sharing the same YOLO color label. Low agreement signals localized confusion consistent with anomaly clusters.lateral_outlier, |ycar − mean(ycar of same-color neighbors)|. A cone displaced laterally from its color-class peers is geometrically inconsistent with the expected track layout.relative_size, bbox_h / median(bbox_h within frame). Anomalies often correspond to undersized detections at range; normalizing by the within-frame median removes absolute distance effects.is_in_corner, 1 if |yaw_rate_radps| > 0.2 rad/s, else 0. Corners introduce camera rotation that degrades projection accuracy.corner_x_prior, is_in_corner × prior_disagreement. Interaction term that amplifies the prior-disagreement signal specifically during cornering, where temporal inconsistency is most informative.A single unified classifier trained on all three cone classes performs sub-optimally because boundary and orange cones have fundamentally different failure mechanisms:
Both models share the same 17-feature set and hyperparameter grid. Thresholds are tuned independently on the validation split to prevent rare-class bias.
Frame-level temporal split. Rows are sorted by frame_id and split at the 70th and 85th percentiles. This prevents label leakage between cones co-detected in the same frame and ensures test detections come from novel track positions unseen during training.
Early stopping. Training halts when PR-AUC on the validation set fails to improve for 30 consecutive boosting rounds.
Per-class threshold tuning. The decision threshold is swept from 0.1 to 0.9 in 0.01 increments on the validation split, and the F1-maximizing threshold is selected independently for each model. Without separate tuning, scale_pos_weight can cause over-flagging of orange or under-flagging of boundary depending on the class frequency ratio.
All metrics are evaluated on the held-out test set (30,547 detections, per-frame, no temporal smoothing).
| Class | F1 | Precision | Recall |
|---|---|---|---|
| Blue | 0.940 | 0.95 | 0.96 |
| Yellow | 0.938 | 0.98 | 0.91 |
| Orange | 0.546 | 0.61 | 0.42 |
| Macro avg | 0.906 | n/a | n/a |
Blue and yellow boundary classes achieve near-optimal F1; orange is limited by data scarcity despite the 19% anomaly rate.

is_in_corner dominates at 0.205; yolo_confidence (0.115) and yc_orange (0.090) follow. All five engineered features appear in the top 10.is_in_corner is the dominant split variable by a wide margin. The corner flag alone accounts for more than twice the gain of the second-ranked feature, consistent with the Phase 1 observation that camera rotation during cornering is the primary driver of anomaly risk. The model arrived at this ranking through split-gain optimization with no explicit hypothesis encoded. neighbor_agree and lateral_outlier rank fourth and fifth, confirming that spatial context features add discriminating power beyond what single-detection geometry provides.

The test set confusion matrix (boundary + orange models combined) shows TN = 25,253, TP = 403, FP = 25, FN = 51. The FP:FN ratio of 25:51 reflects the high-recall threshold tuning. The model is configured to miss few anomalies at the cost of occasional false flags. A flagged detection is suppressed rather than corrected; the asymmetric cost is that a false alarm causes a missed detection (recoverable from subsequent frames), while a false negative passes a misclassification directly to the path planner.

In the vehicle frame, false negatives (red, 51) cluster in the mid-to-long range band (xcar = 8 to 16 m) and near the lateral extremes. False positives (orange, 25) are sparse and widely dispersed, confirming the model rarely flags correct detections. In confidence-distance space, FNs span the full confidence range but concentrate below 0.7, the hard-negative regime where anomalies are structurally similar to correct detections.

yolo_confidence is the strongest anomaly driver; yaw_rate_radps and bbox_h follow. Rankings are consistent with Phase 1 analysis and the gain importance in Fig. 6.High yolo_confidence (red) contributes large negative SHAP values, pushing toward normal, while low confidence (blue) drives positive anomaly contributions up to +7 log-odds units. This matches the Phase 1 observation of a bimodal FP confidence distribution. High yaw_rate_radps (sharp corner, red) pushes toward anomaly. bbox_h shows a directional range-proxy effect: small bounding boxes (long range) increase anomaly risk; large boxes (close range) push toward normal. The SHAP rankings match the Phase 1 causal ordering: confidence, then dynamics, then geometry.
The agreement between Phase 1 physics analysis and Phase 2 learned representations is a key result of this work: corner risk, confidence separability, and Orange fragility all emerge from split-gain optimization without explicit encoding.
The anomaly detector does not improve YOLO itself. YOLO per-frame accuracy is unchanged. The detector improves system-level safety by identifying approximately 91% of YOLO color errors at 94% precision before they reach the steering controller. This reduces the rate of incorrect color labels reaching downstream control from 2.73% to approximately 0.24%, a 91% reduction in the failure mode that causes incorrect lane assignment.
Operationally, the detector runs as a post-processing layer on each YOLO output frame. A flagged detection is suppressed (treated as no detection for that cone in that frame) or overridden by the most recent confident detection of the same physical cone. Inference latency is negligible: XGBoost on 17 scalar features processes a full frame of 20 cones in under 0.3 ms on a Raspberry Pi 4, well within the YOLO inference budget.
The combined Phase 1 + Phase 2 pipeline implements a dual logic gate:
Phase 1:  d > 1.2 m  AND  conf < 0.70
Phase 2:  P(anomaly | features) > θ_class
Detections flagged by the Phase 1 geometric rule are prioritized for Phase 2 re-scoring. Those further confirmed by Phase 2 are suppressed. Detections below the Phase 1 threshold are passed directly to the path planner with acceptably low FP risk.
Orange data scarcity. Per-class F1 = 0.546 for orange reflects fundamental data limitations: orange cones are sparse per lap (start/finish and chicane only), so the orange anomaly class has far fewer training examples than either boundary class. Denser orange placement in the simulator, through additional chicane entries, more lap markers, or dedicated orange-cone test circuits, would directly improve both precision and recall.
Temporal smoothing. We explored identifying the same physical cone across frames via world-frame projection and averaging anomaly probability over a sliding window. A naive implementation (rolling mean, 5-frame window, 0.7 m matching distance) degraded performance, suggesting the approach requires confidence-weighted aggregation, asymmetric updates (anomaly flags should persist once set), and track-quality filtering. Principled temporal aggregation is left to future work; it is the most promising direction for improving orange detection where per-frame data is fundamentally sparse.
Additional directions include evaluation under real lighting variation (not available in FSDS), integration with the SLAM module to use world-frame cone positions as additional features, and online adaptation of the detection thresholds as the vehicle accumulates lap-specific statistics during a competition day.